Phylo-VISTA Help/FAQ
-
System Requirements
Your interenet browser should have Java Plug-in 1.4.2 (it usually comes by default on most recent platforms).
We have tested the following platforms:- MacOS X (10.2.6): Safari 1.0 and Internet Explorer 5.2.2
- Windows: Mozilla 1.1, Internet Explorer 6, Netscape 6.2 and 7
- Linux: Mozilla 1.0.1
It does not work with Windows/IE 5.
-
Input format
Multiple alignment file:
The file should be in multi-fasta alignment format. This is a standart output of a global alignment with a program like MLAGAN.
The sequence data you submit must be aligned. If you have sequences that are not aligned, please visit MLAGAN website for example.
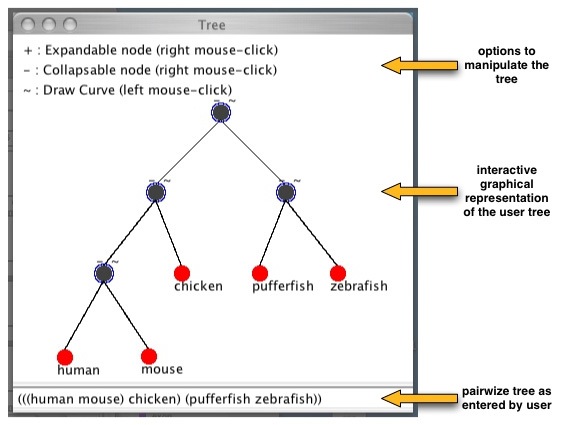
Phylogenetic tree:
the server requests a tree. For now, the format accepted is the pairwize phylogenetic tree. For example, for human, mouse, chicken. fugu, zebrafish the tree is
(((human mouse) chicken) (fugu zebrafish))
Each sequence name should separated by a space and for each node you should put parenthesis around its child nodes. Below is an example of such a tree.
If you do not know the pairwize tree when asked by the server (STEP 3) you can just leave the default one which is given and update it later once the applet is started.
Annotations:
Annotations format accepted is GFF. Some example files are here.
PLEASE NOTE
- use the same names for sequences in the alignment file, phylogenetic tree and annotations.
- some sample input files can be obtained from here
-
Browsing capabilities
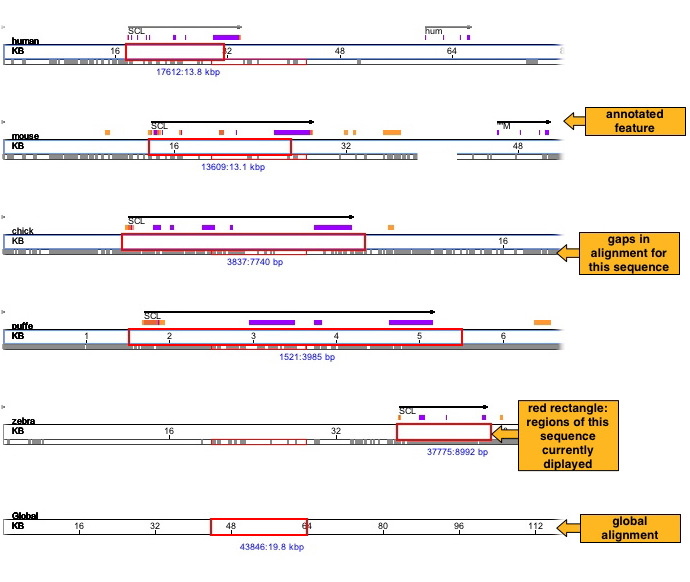
Sequence traversal bar:
There is a sequence traversal bar for each sequence and for the global alignment. You can browse through the alignment using any one of them. The red rectangle shows the selected region. You can drag it, resize it and place it at a particular position. If you have supplied any annotations then they will be seen above the bar of the corresponding sequence. You can see the detailed annotation on mouse-over. Please see the legend window for details. Below the red rectangle the numbers show the starting coordinate of the selected region and the length of the selected region in the corresponding sequence. The figure below shows a human sequence traversal bar.
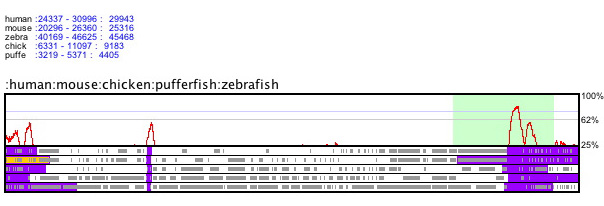
Mouse Zoom-in operator:
You can zoom-in to a selected region using mouse. You'll see the selected region in green as shown in the figure below.
Specify coordinates:
You can select the sequence whose coordinates you want to specify from the drop down list. Then specify the start coordinate in the start textbox and length of the sequence in the textbox next to it. Press the "Go" button to see the plots.

Block-wise:
You can browse through your alignment data in blocks by using ">" and "<" buttons.
Zoom buttons:
You can zoom-in by using "+" button and zoom-out using "-" button.
Phylogenetic tree:
You can choose which plots to see by selecting nodes from the phylogenetic tree. Press "Plot curves" button after changing selection in the phylogenetic tree.
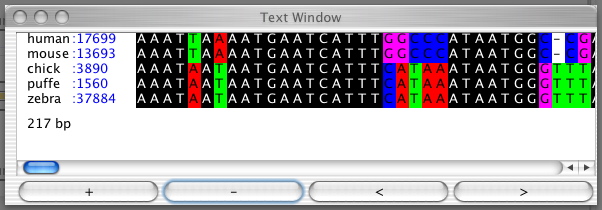
Text Window:
Press the "Text" button to see the selected alignment as text.
-
Similarity plots
Corresponding to each selected node in the phylogenetic tree a similarity plot is shown. The red curve shows the similarity measure calculated over a user-definable window. Below the plot you can see annotations for the sequences. Gray rectangles are gaps, blue are exons and yellow are user-defined annotations. The plot area is shaded in gray when all the sequences of the plot have gaps.
-
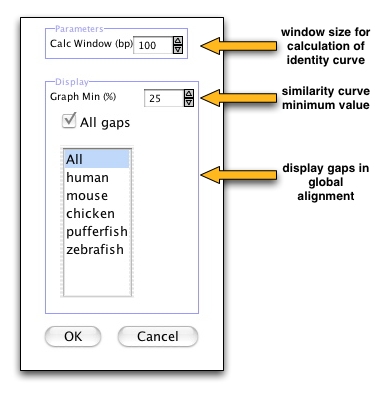
Settings
- you can specify the window width for calculating similarity by changing the parameter "Calc Window (bp)". The default value is 100bp,
- the similarity curve varies from 0% to 100%. You can choose the minimum percentage to be shown in the plot by changing "Graph Min (%)",
- you can switch off the visualization of all gaps gray shaded region in the plots or you can choose the sequences for which you want to see annotations and gap information (by default all sequences are selected).
Please send an e-mail to phylovista @ lbl.gov if you have further questions.