Examples
(A step by step tutorial on how to start a project, manipulate the tree, use basic and advanced query tools to explore functional traits and export results)
Example 1 - from database
Make queries
- Load
input files. The input order matters. Always import .db, .tre and .ky.
- File -> import -> Database Connection -> SampleDBDerby.db
- File -> import -> Tree Description -> SampleTAXONTreeDerby.tre
- File -> import -> Key Description -> SampleKeyFileDerby.ky
- The tree is from the IMG TAXON table and therefore branches are of the same length. The tree is displayed in the "Fit whole tree" mode. Use tools located on the "Display Options" (F) panel to manipulate the tree to the desired resolution and state. Refer to "Display & Function Overview"->"Tool Pane"->"Display Option" panel for more details.
-
Use "Basic
Queries" panel to construct queries
Select "Basic Queries" panel from tabbed pane.
Q1: Find all
Actinobacteria that contains the enzyme phosphoribosylanthranilate isomerase (COG0135).
TAXON.PHYLUM =
Actinobacteria, AND COG.COG_ID = COG0135
- Choose "TAXON" for Table, "PHYLUM" for Key, "=" for Assignment, type "Actinobacteria" for Value. You can check "P" (populate list) check box to let the program automatically fill the combo box and then pick the desired value. Leave Operations blank, since this is our first condition.
-
Click on "Add"
 button
to push it to the condition list below.
button
to push it to the condition list below. - Choose "COG" for table, "COG_ID" for Key, "=" for Assignment, "COG0135" for Value and "AND" for Operations.
- Click "Add" button.
- Click "Go" button.
Q2.
Find all gamma-proteobacteria
with more than 3000 genes.
TAXON.IR_CLASS = Gammaproteobacteria, AND TAXON_INFO.COUNT_CDS > 3000
- Choose "TAXON" for Table, "IR_CLASS" for Key, "=" for Assignment, "Gammaproteobacteria" for Value and blank for Operations.
- Click "Add" icon.
- Choose "TAXON_INFO" for Table, "COUNT_CDS" for Key, ">" for Assignment, "3000" for Value and "AND" for Operations.
- Click "Add" icon.
- Click "Go" button
Q3. Find all archaea
with G+C content of DNA greater than 50%.
TAXON.DOMAIN = Archaea, AND TAXON_INFO.GC_PERCENT > .5
- Choose "TAXON" for Table, "DOMAIN" for Key, "=" for Assignment, "Archaea" for Value and blank for Operations.
- Click "Add" icon.
- Choose "TAXON_INFO" for Table, "GC_PERCENT" for Key, ">" for Assignment, ".5" for Value and "AND" for Operations.
- Click "Add" icon.
- Click "Go" button.
Q4. Find all Archaea that are Aerobe or Strict Aerobe (Phenotype "Aerobe" or "strict aerobe")
- Go to the "Advanced Queries" panel on the tabbed tool pane.
- Type in the SQL section "select TAXON.* from TAXON, PHENOTYPECV, TAXON_PHENOTYPE where TAXON.DOMAIN='Archaea' and (PHENOTYPECV.PHENOTYPE_TERM = 'Aerobe' or PHENOTYPECV.PHENOTYPE_TERM = 'Strict Aerobe') and TAXON.TAXON_OID = TAXON_PHENOTYPE.TAXON_OID and TAXON_PHENOTYPE.PHENOTYPE = PHENOTYPECV.PHENOTYPE_OID"
- Click on "go"" button.
Q5. Find all organisms that are Aerobe (Phenotype "Aerobe") and COG is COG0135.
- Go to the "Advanced Queries" panel on the tabbed tool pane.
- Type in the SQL section "select TAXON.* from COG, GENE_COG_GROUPS, GENE, PHENOTYPECV, TAXON_PHENOTYPE, TAXON where TAXON_PHENOTYPE.PHENOTYPE = PHENOTYPECV.PHENOTYPE_OID and TAXON_PHENOTYPE.TAXON_OID = TAXON.TAXON_OID and TAXON.TAXON_OID = GENE.TAXON and GENE.GENE_OID = GENE_COG_GROUPS.GENE_OID and GENE_COG_GROUPS.COG = COG.COG_ID and PHENOTYPECV.PHENOTYPE_TERM = 'Aerobe' AND COG.COG_ID = 'COG0135'"
- Click on "go" button.
NOTE: when type SQL statements, make sure you have the necessary connection between tables. In the example of Q4, this refers to the "... TAXON.TAXON_OID = TAXON_PHENOTYPE.TAXON_OID and TAXON_PHENOTYPE.PHENOTYPE = PHENOTYPECV.PHENOTYPE_OID" part.
Discussion for Q1
This example shows one way in which a tree view of search results is helpful. Phosphoribosylanthranilate isomerase (PRAI) catalyzes the third step in the synthesis of tryptophan from chorismate. Enzymes with this activity are all related and belong to COG0135 of the Clusters of Orthologous Groups (COG) classification. Some Actinobacteria do not possess a separate gene encoding PRAI. Instead they have a bifunctional enzyme with PRAI and N’-[(5’-phosphoribosyl)-formimino]-5-aminoimidazole-4-carboxamide ribonucleotide isomerase (hisA) activities (Barona-Gomez and Hodgson, 2003). The HisA protein catalyzes the fourth step of histidine biosynthesis.
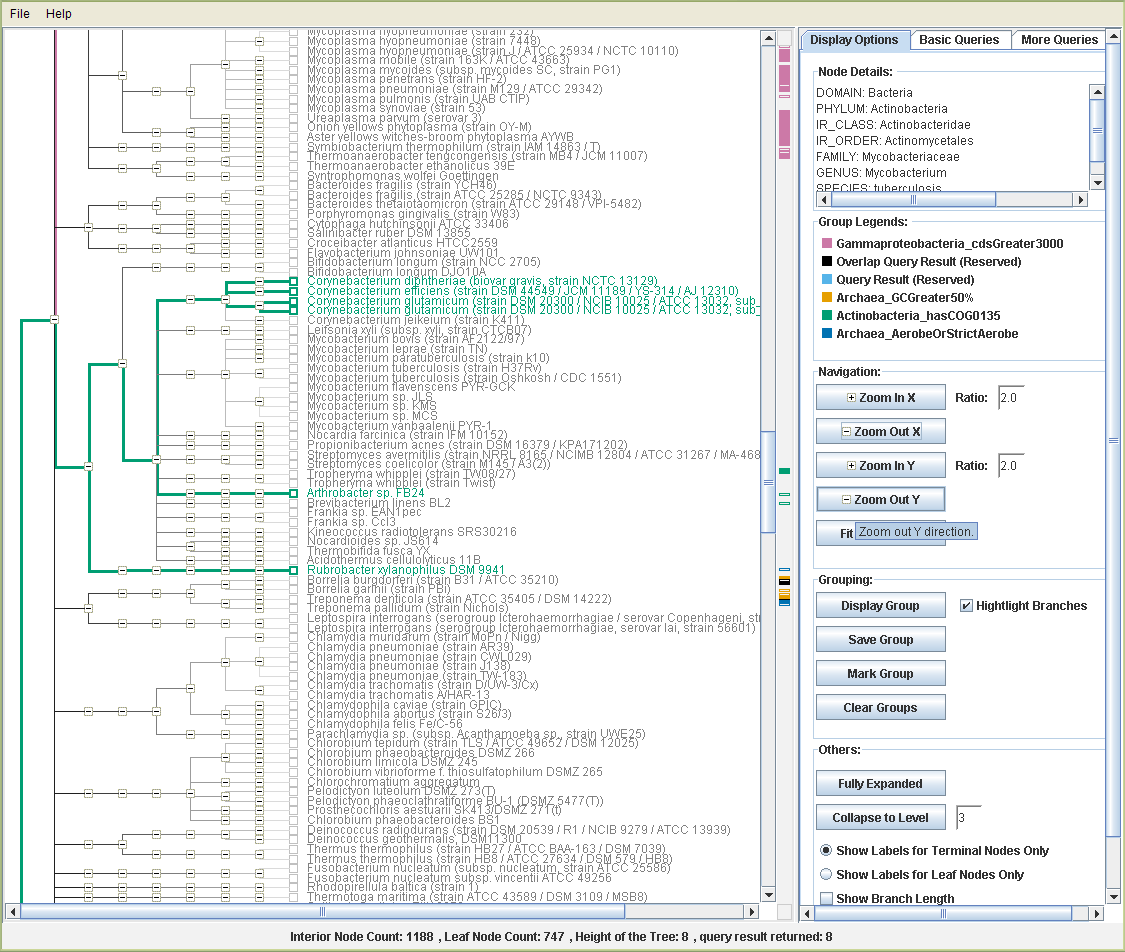
Not all Actinobacteria have this bifunctional enzyme, however. Most of the Corynebacterium species with sequenced genomes have a protein belonging to COG0135, along with Arthrobacter sp. FB24 and Rubrobacter xylanophilus. Draft genomes are available for the last two organisms. When a COG is present in some organisms in a group, but missing from others, it is important to see how the organisms are related in order to determine the evolutionary history of the gene. A tree view of the presence of COG0135 in Actinobacteria shows that most of the organisms lack this COG, so the ancestral Actinobacterium probably did not have the gene. The tree also shows that the organisms with COG0135 do not all group together, thus the gene was probably acquired independently by the Corynebacteria, Arthrobacter, and Rubrobacter. One can also see that the ancestor of Corynebacterium species probably had the gene, but it was subsequently lost in C. jeikeium. These types of observations are much easier to discover with a tree view. According to this scenario we would expect a phylogenetic tree of COG0135 to show that the Corynebacterium, Arthrobacter, and Rubrobacter sequences are not closely related to each other, and this is indeed the case.
Figure: COG1035Tree
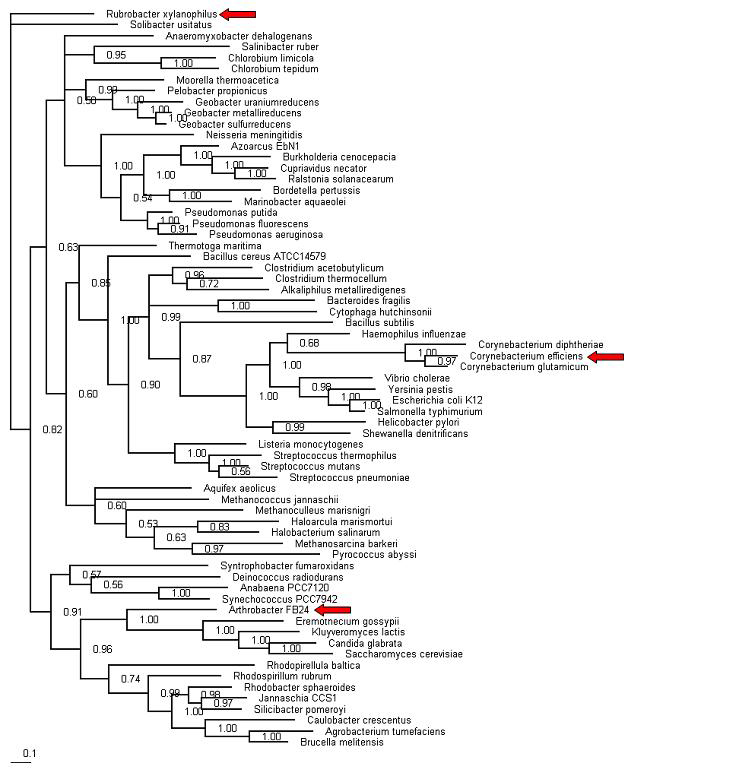
Figure: TreeQ-VISTA_COG1035
References
Barona-Gómez, F. and Hodgson, D. A. 2003. Occurrence of a putative ancient-like isomerase involved in histidine and tryptophan biosynthesis. EMBO Rep. 4, 296-300.
Example 2 - from newick formatted file
Loading a tree from file & pre-defined groups from file
- File->Import->Tree Description->sampleTree1.newick
- File->Import->Groups->sampleGroup1.grp
The user can hand mark the tree using the mark group tools on the "Display Options" panel.
See "Display & Function Overview"->"Tool Pane"->"Display Option" for more information.
Many applications can convert other tree formats into newick format. Although complex queries are not possible from a flat file, we provide the capability of displaying pre-saved traits for a flat filed tree. It is the complex queries into a database and dynamic projection in context of a phylogeny that make this project unique and powerful to users. Many databases are free and users can write a program to input data from a flat file to a database.